The River Herring Avoidance Program Forecast (RHAPCAST) maps identify areas to encounter target species (Atlantic herring or Atlantic mackerel) and avoid encountering river herring bycatch. Forecasts are provided about one week in advance to help you plan. Look for a new forecast each Monday! The model uses historical presence-absence data from NMFS trawl surveys, historical environmnetal data, and forecasted sea surface temperature data to predict where we expect the relevant species to be distributed a particular week.
October 17, 2026 to October 23, 2026 forecast to catch Atlantic herring and avoid river herring
The blue areas on the map (Avoid river herring and catch Atlantic herring map) show places where Atlantic herring are likely to be present and where river herring are likely to be absent. The red and brown areas show places where river herring are likely to be present or where Atlantic herring are likely to be absent. We recommend going to the blue areas. Click on the map for more information on the exact encounter probability, and spatial coordinates can be found at the bottom left of the map. A grid cell is approximately 130 km2 (height ~ 9 km and width ~ 14 km). Please refer to state and federal regulations for any restrictions.
(Interactive map — zoom & explore!)
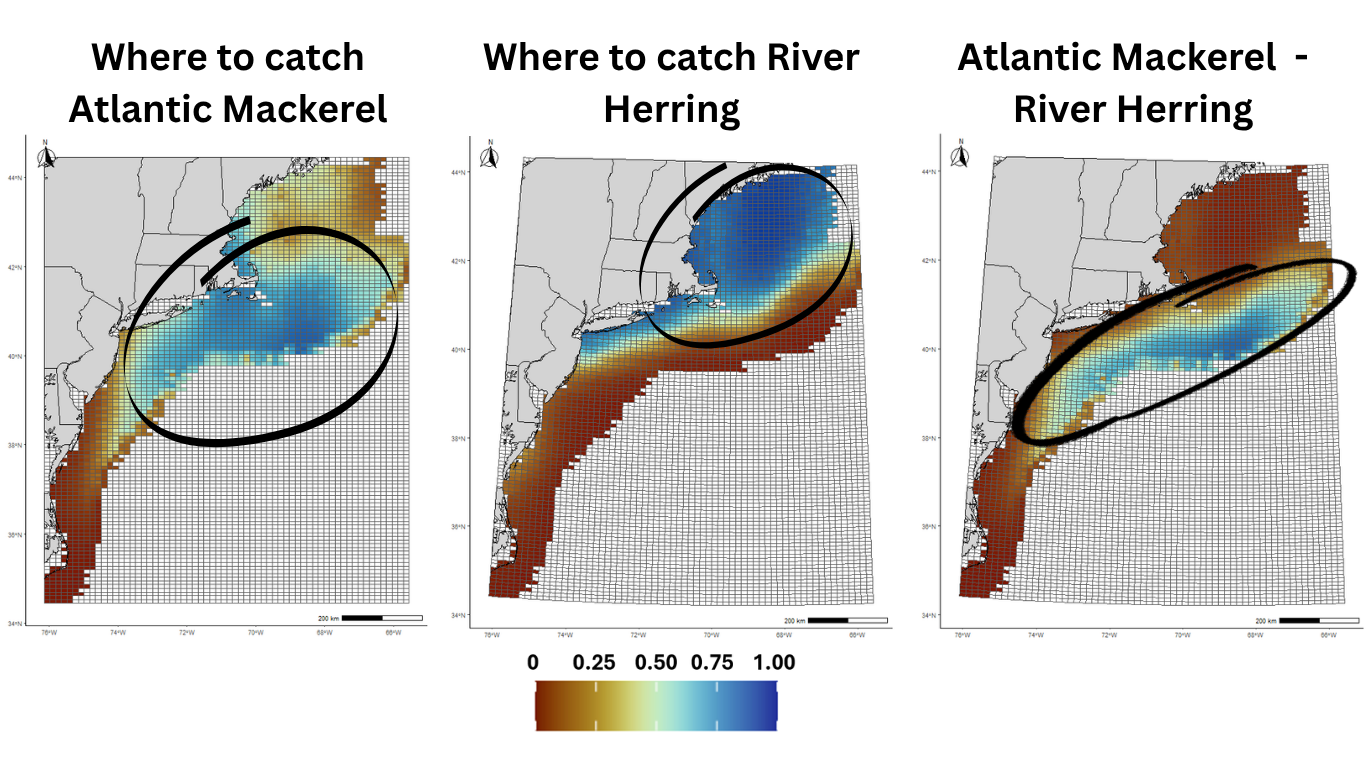
⛶Individual maps of each species. Blue areas show places where the species are present and red/brown areas show where the species are absent. Click on tabs for maps! Please refer to state and federal regulations for any restrictions.
October 17, 2026 to October 23, 2026 Forecast to catch Atlantic mackerel and avoid river herring
The blue areas on the map (Avoid river herring and catch Atlantic mackerel map) show places where Atlantic mackerel are likely to be present and where river herring are likely to be absent. The red and brown areas show places where river herring are likely to be present or where Atlantic mackerel are likely to be absent. We recommend going to the blue areas. Click on the map for more information on the exact encounter probability, and spatial coordinates can be found at the bottom left of the map. A grid cell is approximately 130 km2 (height ~ 9 km and width ~ 14 km). Please refer to state and federal regulations for any restrictions.
(Interactive map — zoom & explore!)
⛶Individual maps of each species. Blue areas show places where the species are present and red/brown areas show where the species are absent. Click on tabs for maps! Please refer to state and federal regulations for any restrictions.
Feedback / Questions
Download background information of RHAP CAST models